CESM Output
We’ll be loading in data from the aquaplanet experiments to look at and understand CESM’s output data better.
[3]:
import matplotlib.pyplot as plt
import numpy as np
import xarray as xr
We’ll use xarray to open CESM’s datasets. The data’s location depends on what archiving method you used, but if you used short term archiving, it should be in a format similar to what we have below.
[2]:
data_control = xr.open_dataset("/data/keeling/a/pappup2/a/CESM/cam5_new/CESM_output_data/atm/hist/cam5_new.cam.h0.0020-12.nc") #End of 20 year

#data_control is the experiment run with the control SST.

data_00 = xr.open_dataset("/data/keeling/a/pappup2/a/CESM/cam_00/CESM_output_data/atm/hist/cam_00.cam.h0.0020-12.nc") #End of 20 year

#data_00 is run with a perturbation of 2K at the equator
[4]:
data_00

#Here's what CESM output datasets typically look like.
[4]:
<xarray.Dataset>
Dimensions:        (lev: 30, ilev: 31, time: 1, lat: 96, lon: 144, slat: 95,
                    slon: 144, nbnd: 2)
Coordinates:
  * lev            (lev) float64 3.643 7.595 14.36 24.61 ... 957.5 976.3 992.6
  * ilev           (ilev) float64 2.255 5.032 10.16 18.56 ... 967.5 985.1 1e+03
  * time           (time) object 0021-01-01 00:00:00
  * lat            (lat) float64 -90.0 -88.11 -86.21 -84.32 ... 86.21 88.11 90.0
  * lon            (lon) float64 0.0 2.5 5.0 7.5 ... 350.0 352.5 355.0 357.5
  * slat           (slat) float64 -89.05 -87.16 -85.26 ... 85.26 87.16 89.05
  * slon           (slon) float64 -1.25 1.25 3.75 6.25 ... 351.2 353.8 356.2
Dimensions without coordinates: nbnd
Data variables: (12/163)
    hyam           (lev) float64 0.003643 0.007595 0.01436 ... 0.001989 0.0
    hybm           (lev) float64 0.0 0.0 0.0 0.0 ... 0.9251 0.9512 0.9743 0.9926
    hyai           (ilev) float64 0.002255 0.005032 0.01016 ... 0.003979 0.0 0.0
    hybi           (ilev) float64 0.0 0.0 0.0 0.0 ... 0.9389 0.9636 0.9851 1.0
    P0             float64 1e+05
    date           (time) int32 210101
    ...             ...
    pom_a1_SRF     (time, lat, lon) float32 9.574e-15 9.574e-15 ... 9.273e-14
    so4_a1_SRF     (time, lat, lon) float32 9.113e-12 9.114e-12 ... 4.953e-12
    so4_a2_SRF     (time, lat, lon) float32 4.792e-12 4.792e-12 ... 1.034e-12
    so4_a3_SRF     (time, lat, lon) float32 1.57e-13 1.57e-13 ... 4.112e-15
    soa_a1_SRF     (time, lat, lon) float32 3.739e-16 3.739e-16 ... 1.525e-13
    soa_a2_SRF     (time, lat, lon) float32 2.563e-17 2.564e-17 ... 8.942e-15
Attributes:
    Conventions:      CF-1.0
    source:           CAM
    case:             cam_00
    title:            UNSET
    logname:          pappup2
    host:             keeling-j01
    Version:          $Name$
    revision_Id:      $Id$
    initial_file:     /data/keeling/a/pappup2/a/CESM/CESM_input_data/atm/cam/...
    topography_file:  /data/keeling/a/pappup2/a/CESM/CESM_input_data/atm/cam/...
xarray.Dataset
- lev: 30
- ilev: 31
- time: 1
- lat: 96
- lon: 144
- slat: 95
- slon: 144
- nbnd: 2
- lev(lev)float643.643 7.595 14.36 ... 976.3 992.6
- long_name :
- hybrid level at midpoints (1000*(A+B))
- units :
- level
- positive :
- down
- standard_name :
- atmosphere_hybrid_sigma_pressure_coordinate
- formula_terms :
- a: hyam b: hybm p0: P0 ps: PS
array([ 3.643466, 7.59482 , 14.356632, 24.61222 , 38.2683 , 54.59548 , 72.012451, 87.82123 , 103.317127, 121.547241, 142.994039, 168.22508 , 197.908087, 232.828619, 273.910817, 322.241902, 379.100904, 445.992574, 524.687175, 609.778695, 691.38943 , 763.404481, 820.858369, 859.534767, 887.020249, 912.644547, 936.198398, 957.48548 , 976.325407, 992.556095]) - ilev(ilev)float642.255 5.032 10.16 ... 985.1 1e+03
- long_name :
- hybrid level at interfaces (1000*(A+B))
- units :
- level
- positive :
- down
- standard_name :
- atmosphere_hybrid_sigma_pressure_coordinate
- formula_terms :
- a: hyai b: hybi p0: P0 ps: PS
array([ 2.25524 , 5.031692, 10.157947, 18.555317, 30.669123, 45.867477, 63.323483, 80.701418, 94.941042, 111.693211, 131.401271, 154.586807, 181.863353, 213.952821, 251.704417, 296.117216, 348.366588, 409.835219, 482.149929, 567.224421, 652.332969, 730.445892, 796.363071, 845.353667, 873.715866, 900.324631, 924.964462, 947.432335, 967.538625, 985.11219 , 1000. ]) - time(time)object0021-01-01 00:00:00
- long_name :
- time
- bounds :
- time_bnds
array([cftime.DatetimeNoLeap(21, 1, 1, 0, 0, 0, 0, has_year_zero=True)], dtype=object) - lat(lat)float64-90.0 -88.11 -86.21 ... 88.11 90.0
- long_name :
- latitude
- units :
- degrees_north
array([-90. , -88.105263, -86.210526, -84.315789, -82.421053, -80.526316, -78.631579, -76.736842, -74.842105, -72.947368, -71.052632, -69.157895, -67.263158, -65.368421, -63.473684, -61.578947, -59.684211, -57.789474, -55.894737, -54. , -52.105263, -50.210526, -48.315789, -46.421053, -44.526316, -42.631579, -40.736842, -38.842105, -36.947368, -35.052632, -33.157895, -31.263158, -29.368421, -27.473684, -25.578947, -23.684211, -21.789474, -19.894737, -18. , -16.105263, -14.210526, -12.315789, -10.421053, -8.526316, -6.631579, -4.736842, -2.842105, -0.947368, 0.947368, 2.842105, 4.736842, 6.631579, 8.526316, 10.421053, 12.315789, 14.210526, 16.105263, 18. , 19.894737, 21.789474, 23.684211, 25.578947, 27.473684, 29.368421, 31.263158, 33.157895, 35.052632, 36.947368, 38.842105, 40.736842, 42.631579, 44.526316, 46.421053, 48.315789, 50.210526, 52.105263, 54. , 55.894737, 57.789474, 59.684211, 61.578947, 63.473684, 65.368421, 67.263158, 69.157895, 71.052632, 72.947368, 74.842105, 76.736842, 78.631579, 80.526316, 82.421053, 84.315789, 86.210526, 88.105263, 90. ]) - lon(lon)float640.0 2.5 5.0 ... 352.5 355.0 357.5
- long_name :
- longitude
- units :
- degrees_east
array([ 0. , 2.5, 5. , 7.5, 10. , 12.5, 15. , 17.5, 20. , 22.5, 25. , 27.5, 30. , 32.5, 35. , 37.5, 40. , 42.5, 45. , 47.5, 50. , 52.5, 55. , 57.5, 60. , 62.5, 65. , 67.5, 70. , 72.5, 75. , 77.5, 80. , 82.5, 85. , 87.5, 90. , 92.5, 95. , 97.5, 100. , 102.5, 105. , 107.5, 110. , 112.5, 115. , 117.5, 120. , 122.5, 125. , 127.5, 130. , 132.5, 135. , 137.5, 140. , 142.5, 145. , 147.5, 150. , 152.5, 155. , 157.5, 160. , 162.5, 165. , 167.5, 170. , 172.5, 175. , 177.5, 180. , 182.5, 185. , 187.5, 190. , 192.5, 195. , 197.5, 200. , 202.5, 205. , 207.5, 210. , 212.5, 215. , 217.5, 220. , 222.5, 225. , 227.5, 230. , 232.5, 235. , 237.5, 240. , 242.5, 245. , 247.5, 250. , 252.5, 255. , 257.5, 260. , 262.5, 265. , 267.5, 270. , 272.5, 275. , 277.5, 280. , 282.5, 285. , 287.5, 290. , 292.5, 295. , 297.5, 300. , 302.5, 305. , 307.5, 310. , 312.5, 315. , 317.5, 320. , 322.5, 325. , 327.5, 330. , 332.5, 335. , 337.5, 340. , 342.5, 345. , 347.5, 350. , 352.5, 355. , 357.5]) - slat(slat)float64-89.05 -87.16 ... 87.16 89.05
- long_name :
- staggered latitude
- units :
- degrees_north
array([-89.052632, -87.157895, -85.263158, -83.368421, -81.473684, -79.578947, -77.684211, -75.789474, -73.894737, -72. , -70.105263, -68.210526, -66.315789, -64.421053, -62.526316, -60.631579, -58.736842, -56.842105, -54.947368, -53.052632, -51.157895, -49.263158, -47.368421, -45.473684, -43.578947, -41.684211, -39.789474, -37.894737, -36. , -34.105263, -32.210526, -30.315789, -28.421053, -26.526316, -24.631579, -22.736842, -20.842105, -18.947368, -17.052632, -15.157895, -13.263158, -11.368421, -9.473684, -7.578947, -5.684211, -3.789474, -1.894737, 0. , 1.894737, 3.789474, 5.684211, 7.578947, 9.473684, 11.368421, 13.263158, 15.157895, 17.052632, 18.947368, 20.842105, 22.736842, 24.631579, 26.526316, 28.421053, 30.315789, 32.210526, 34.105263, 36. , 37.894737, 39.789474, 41.684211, 43.578947, 45.473684, 47.368421, 49.263158, 51.157895, 53.052632, 54.947368, 56.842105, 58.736842, 60.631579, 62.526316, 64.421053, 66.315789, 68.210526, 70.105263, 72. , 73.894737, 75.789474, 77.684211, 79.578947, 81.473684, 83.368421, 85.263158, 87.157895, 89.052632]) - slon(slon)float64-1.25 1.25 3.75 ... 353.8 356.2
- long_name :
- staggered longitude
- units :
- degrees_east
array([ -1.25,   1.25,   3.75,   6.25,   8.75,  11.25,  13.75,  16.25,  18.75,
        21.25,  23.75,  26.25,  28.75,  31.25,  33.75,  36.25,  38.75,  41.25,
        43.75,  46.25,  48.75,  51.25,  53.75,  56.25,  58.75,  61.25,  63.75,
        66.25,  68.75,  71.25,  73.75,  76.25,  78.75,  81.25,  83.75,  86.25,
        88.75,  91.25,  93.75,  96.25,  98.75, 101.25, 103.75, 106.25, 108.75,
       111.25, 113.75, 116.25, 118.75, 121.25, 123.75, 126.25, 128.75, 131.25,
       133.75, 136.25, 138.75, 141.25, 143.75, 146.25, 148.75, 151.25, 153.75,
       156.25, 158.75, 161.25, 163.75, 166.25, 168.75, 171.25, 173.75, 176.25,
       178.75, 181.25, 183.75, 186.25, 188.75, 191.25, 193.75, 196.25, 198.75,
       201.25, 203.75, 206.25, 208.75, 211.25, 213.75, 216.25, 218.75, 221.25,
       223.75, 226.25, 228.75, 231.25, 233.75, 236.25, 238.75, 241.25, 243.75,
       246.25, 248.75, 251.25, 253.75, 256.25, 258.75, 261.25, 263.75, 266.25,
       268.75, 271.25, 273.75, 276.25, 278.75, 281.25, 283.75, 286.25, 288.75,
       291.25, 293.75, 296.25, 298.75, 301.25, 303.75, 306.25, 308.75, 311.25,
       313.75, 316.25, 318.75, 321.25, 323.75, 326.25, 328.75, 331.25, 333.75,
       336.25, 338.75, 341.25, 343.75, 346.25, 348.75, 351.25, 353.75, 356.25])
- hyam(lev)float64...
- long_name :
- hybrid A coefficient at layer midpoints
array([0.003643, 0.007595, 0.014357, 0.024612, 0.038268, 0.054595, 0.072012, 0.087821, 0.103317, 0.121547, 0.142994, 0.168225, 0.178231, 0.170324, 0.161023, 0.15008 , 0.137207, 0.122062, 0.104245, 0.084979, 0.066502, 0.050197, 0.037189, 0.028432, 0.022209, 0.016407, 0.011075, 0.006255, 0.001989, 0. ]) - hybm(lev)float64...
- long_name :
- hybrid B coefficient at layer midpoints
array([0. , 0. , 0. , 0. , 0. , 0. , 0. , 0. , 0. , 0. , 0. , 0. , 0.019677, 0.062504, 0.112888, 0.172162, 0.241894, 0.323931, 0.420442, 0.5248 , 0.624888, 0.713208, 0.78367 , 0.831103, 0.864811, 0.896237, 0.925124, 0.951231, 0.974336, 0.992556]) - hyai(ilev)float64...
- long_name :
- hybrid A coefficient at layer interfaces
array([0.002255, 0.005032, 0.010158, 0.018555, 0.030669, 0.045867, 0.063323, 0.080701, 0.094941, 0.111693, 0.131401, 0.154587, 0.181863, 0.174598, 0.166051, 0.155995, 0.144165, 0.130248, 0.113876, 0.094614, 0.075344, 0.057659, 0.042735, 0.031643, 0.025221, 0.019197, 0.013618, 0.008531, 0.003979, 0. , 0. ]) - hybi(ilev)float64...
- long_name :
- hybrid B coefficient at layer interfaces
array([0. , 0. , 0. , 0. , 0. , 0. , 0. , 0. , 0. , 0. , 0. , 0. , 0. , 0.039355, 0.085654, 0.140122, 0.204201, 0.279587, 0.368274, 0.472611, 0.576989, 0.672787, 0.753628, 0.813711, 0.848495, 0.881128, 0.911346, 0.938901, 0.96356 , 0.985112, 1. ]) - P0()float64...
- long_name :
- reference pressure
- units :
- Pa
array(100000.)
- date(time)int32...
- long_name :
- current date (YYYYMMDD)
array([210101], dtype=int32)
- datesec(time)int32...
- long_name :
- current seconds of current date
array([0], dtype=int32)
- w_stag(slat)float64...
- long_name :
- staggered latitude weights
array([0.000547, 0.00164 , 0.002731, 0.003819, 0.004903, 0.005981, 0.007053, 0.008118, 0.009173, 0.010219, 0.011253, 0.012275, 0.013283, 0.014277, 0.015256, 0.016217, 0.017161, 0.018086, 0.018992, 0.019876, 0.020739, 0.02158 , 0.022396, 0.023188, 0.023955, 0.024696, 0.025409, 0.026095, 0.026752, 0.027381, 0.027979, 0.028546, 0.029082, 0.029587, 0.030059, 0.030498, 0.030904, 0.031276, 0.031614, 0.031917, 0.032186, 0.032419, 0.032617, 0.032779, 0.032905, 0.032996, 0.03305 , 0.033068, 0.03305 , 0.032996, 0.032905, 0.032779, 0.032617, 0.032419, 0.032186, 0.031917, 0.031614, 0.031276, 0.030904, 0.030498, 0.030059, 0.029587, 0.029082, 0.028546, 0.027979, 0.027381, 0.026752, 0.026095, 0.025409, 0.024696, 0.023955, 0.023188, 0.022396, 0.02158 , 0.020739, 0.019876, 0.018992, 0.018086, 0.017161, 0.016217, 0.015256, 0.014277, 0.013283, 0.012275, 0.011253, 0.010219, 0.009173, 0.008118, 0.007053, 0.005981, 0.004903, 0.003819, 0.002731, 0.00164 , 0.000547]) - time_bnds(time, nbnd)object...
- long_name :
- time interval endpoints
array([[cftime.DatetimeNoLeap(20, 12, 1, 0, 0, 0, 0, has_year_zero=True), cftime.DatetimeNoLeap(21, 1, 1, 0, 0, 0, 0, has_year_zero=True)]], dtype=object) - date_written(time)|S8...
array([b'02/15/23'], dtype='|S8')
- time_written(time)|S8...
array([b'10:22:05'], dtype='|S8')
- ntrm()int32...
- long_name :
- spectral truncation parameter M
array(1, dtype=int32)
- ntrn()int32...
- long_name :
- spectral truncation parameter N
array(1, dtype=int32)
- ntrk()int32...
- long_name :
- spectral truncation parameter K
array(1, dtype=int32)
- ndbase()int32...
- long_name :
- base day
array(0, dtype=int32)
- nsbase()int32...
- long_name :
- seconds of base day
array(0, dtype=int32)
- nbdate()int32...
- long_name :
- base date (YYYYMMDD)
array(10101, dtype=int32)
- nbsec()int32...
- long_name :
- seconds of base date
array(0, dtype=int32)
- mdt()int32...
- long_name :
- timestep
- units :
- s
array(1800, dtype=int32)
- nlon(lat)int32...
- long_name :
- number of longitudes
array([144, 144, 144, 144, 144, 144, 144, 144, 144, 144, 144, 144, 144, 144, 144, 144, 144, 144, 144, 144, 144, 144, 144, 144, 144, 144, 144, 144, 144, 144, 144, 144, 144, 144, 144, 144, 144, 144, 144, 144, 144, 144, 144, 144, 144, 144, 144, 144, 144, 144, 144, 144, 144, 144, 144, 144, 144, 144, 144, 144, 144, 144, 144, 144, 144, 144, 144, 144, 144, 144, 144, 144, 144, 144, 144, 144, 144, 144, 144, 144, 144, 144, 144, 144, 144, 144, 144, 144, 144, 144, 144, 144, 144, 144, 144, 144], dtype=int32) - wnummax(lat)int32...
- long_name :
- cutoff Fourier wavenumber
array([1, 1, 1, 1, 1, 1, 1, 1, 1, 1, 1, 1, 1, 1, 1, 1, 1, 1, 1, 1, 1, 1, 1, 1, 1, 1, 1, 1, 1, 1, 1, 1, 1, 1, 1, 1, 1, 1, 1, 1, 1, 1, 1, 1, 1, 1, 1, 1, 1, 1, 1, 1, 1, 1, 1, 1, 1, 1, 1, 1, 1, 1, 1, 1, 1, 1, 1, 1, 1, 1, 1, 1, 1, 1, 1, 1, 1, 1, 1, 1, 1, 1, 1, 1, 1, 1, 1, 1, 1, 1, 1, 1, 1, 1, 1, 1], dtype=int32) - gw(lat)float64...
- long_name :
- gauss weights
array([0.000137, 0.001093, 0.002185, 0.003275, 0.004361, 0.005443, 0.006518, 0.007587, 0.008647, 0.009697, 0.010737, 0.011765, 0.012781, 0.013782, 0.014768, 0.015739, 0.016692, 0.017626, 0.018542, 0.019437, 0.020311, 0.021162, 0.021991, 0.022795, 0.023575, 0.024329, 0.025056, 0.025756, 0.026427, 0.02707 , 0.027683, 0.028266, 0.028818, 0.029339, 0.029827, 0.030283, 0.030705, 0.031094, 0.031449, 0.03177 , 0.032056, 0.032307, 0.032522, 0.032702, 0.032847, 0.032955, 0.033027, 0.033063, 0.033063, 0.033027, 0.032955, 0.032847, 0.032702, 0.032522, 0.032307, 0.032056, 0.03177 , 0.031449, 0.031094, 0.030705, 0.030283, 0.029827, 0.029339, 0.028818, 0.028266, 0.027683, 0.02707 , 0.026427, 0.025756, 0.025056, 0.024329, 0.023575, 0.022795, 0.021991, 0.021162, 0.020311, 0.019437, 0.018542, 0.017626, 0.016692, 0.015739, 0.014768, 0.013782, 0.012781, 0.011765, 0.010737, 0.009697, 0.008647, 0.007587, 0.006518, 0.005443, 0.004361, 0.003275, 0.002185, 0.001093, 0.000137]) - ndcur(time)int32...
- long_name :
- current day (from base day)
array([7300], dtype=int32)
- nscur(time)int32...
- long_name :
- current seconds of current day
array([0], dtype=int32)
- co2vmr(time)float64...
- long_name :
- co2 volume mixing ratio
array([0.000367])
- ch4vmr(time)float64...
- long_name :
- ch4 volume mixing ratio
array([1.65e-06])
- n2ovmr(time)float64...
- long_name :
- n2o volume mixing ratio
array([3.06e-07])
- f11vmr(time)float64...
- long_name :
- f11 volume mixing ratio
array([6.5345e-10])
- f12vmr(time)float64...
- long_name :
- f12 volume mixing ratio
array([5.35e-10])
- sol_tsi(time)float64...
- long_name :
- total solar irradiance
- units :
- W/m2
array([-1.])
- nsteph(time)int32...
- long_name :
- current timestep
array([350400], dtype=int32)
- AEROD_v(time, lat, lon)float32...
- units :
- 1
- long_name :
- Total Aerosol Optical Depth in visible band
- cell_methods :
- time: mean
array([[[0.007295, 0.007295, ..., 0.007295, 0.007295], [0.00581 , 0.005874, ..., 0.005721, 0.005777], ..., [0.008051, 0.008121, ..., 0.007841, 0.007908], [0.009631, 0.009631, ..., 0.009626, 0.009631]]], dtype=float32) - ANRAIN(time, lev, lat, lon)float32...
- mdims :
- 1
- units :
- m-3
- long_name :
- Average rain number conc
- cell_methods :
- time: mean
[414720 values with dtype=float32]
- ANSNOW(time, lev, lat, lon)float32...
- mdims :
- 1
- units :
- m-3
- long_name :
- Average snow number conc
- cell_methods :
- time: mean
[414720 values with dtype=float32]
- AODDUST1(time, lat, lon)float32...
- units :
- long_name :
- Aerosol optical depth 550 nm model 1 from dust
- cell_methods :
- time: mean
array([[[1.433309e-15, 1.433309e-15, ..., 1.433309e-15, 1.433309e-15], [1.437638e-15, 1.437193e-15, ..., 1.438187e-15, 1.437973e-15], ..., [1.306262e-15, 1.306607e-15, ..., 1.305833e-15, 1.306122e-15], [1.331040e-15, 1.331040e-15, ..., 1.331040e-15, 1.331040e-15]]], dtype=float32) - AODDUST3(time, lat, lon)float32...
- units :
- long_name :
- Aerosol optical depth 550 nm model 3 from dust
- cell_methods :
- time: mean
array([[[7.382767e-30, 7.382768e-30, ..., 7.382769e-30, 7.382768e-30], [7.532672e-30, 7.561950e-30, ..., 7.455254e-30, 7.476100e-30], ..., [6.538622e-30, 6.538569e-30, ..., 6.516000e-30, 6.539815e-30], [6.726033e-30, 6.726034e-30, ..., 6.726039e-30, 6.726034e-30]]], dtype=float32) - AODVIS(time, lat, lon)float32...
- units :
- long_name :
- Aerosol optical depth 550 nm
- cell_methods :
- time: mean
array([[[0.007295, 0.007295, ..., 0.007295, 0.007295], [0.00581 , 0.005874, ..., 0.005721, 0.005777], ..., [0.008051, 0.008121, ..., 0.007841, 0.007908], [0.009631, 0.009631, ..., 0.009626, 0.009631]]], dtype=float32) - AQRAIN(time, lev, lat, lon)float32...
- mdims :
- 1
- units :
- kg/kg
- long_name :
- Average rain mixing ratio
- cell_methods :
- time: mean
[414720 values with dtype=float32]
- AQSNOW(time, lev, lat, lon)float32...
- mdims :
- 1
- units :
- kg/kg
- long_name :
- Average snow mixing ratio
- cell_methods :
- time: mean
[414720 values with dtype=float32]
- AREI(time, lev, lat, lon)float32...
- mdims :
- 1
- units :
- Micron
- long_name :
- Average ice effective radius
- cell_methods :
- time: mean
[414720 values with dtype=float32]
- AREL(time, lev, lat, lon)float32...
- mdims :
- 1
- units :
- Micron
- long_name :
- Average droplet effective radius
- cell_methods :
- time: mean
[414720 values with dtype=float32]
- AWNC(time, lev, lat, lon)float32...
- mdims :
- 1
- units :
- m-3
- long_name :
- Average cloud water number conc
- cell_methods :
- time: mean
[414720 values with dtype=float32]
- AWNI(time, lev, lat, lon)float32...
- mdims :
- 1
- units :
- m-3
- long_name :
- Average cloud ice number conc
- cell_methods :
- time: mean
[414720 values with dtype=float32]
- BURDEN1(time, lat, lon)float32...
- units :
- kg/m2
- long_name :
- Aerosol burden mode 1
- cell_methods :
- time: mean
array([[[4.763472e-07, 4.763455e-07, ..., 4.763471e-07, 4.763466e-07], [4.317636e-07, 4.331127e-07, ..., 4.281528e-07, 4.294767e-07], ..., [4.710555e-07, 4.731325e-07, ..., 4.673775e-07, 4.688872e-07], [5.089309e-07, 5.089308e-07, ..., 5.089304e-07, 5.089309e-07]]], dtype=float32) - BURDEN2(time, lat, lon)float32...
- units :
- kg/m2
- long_name :
- Aerosol burden mode 2
- cell_methods :
- time: mean
array([[[8.282618e-08, 8.282684e-08, ..., 8.282618e-08, 8.282674e-08], [8.496492e-08, 8.557476e-08, ..., 8.412730e-08, 8.483165e-08], ..., [4.752753e-08, 4.752115e-08, ..., 4.742820e-08, 4.747193e-08], [4.878726e-08, 4.878726e-08, ..., 4.878724e-08, 4.878726e-08]]], dtype=float32) - BURDEN3(time, lat, lon)float32...
- units :
- kg/m2
- long_name :
- Aerosol burden mode 3
- cell_methods :
- time: mean
array([[[5.091224e-06, 5.091200e-06, ..., 5.091224e-06, 5.091225e-06], [3.797557e-06, 3.837370e-06, ..., 3.694168e-06, 3.739009e-06], ..., [5.449653e-06, 5.550660e-06, ..., 5.269749e-06, 5.353737e-06], [6.355777e-06, 6.355774e-06, ..., 6.355824e-06, 6.355777e-06]]], dtype=float32) - BURDENBC(time, lat, lon)float32...
- units :
- kg/m2
- long_name :
- Black carbon aerosol burden
- cell_methods :
- time: mean
array([[[1.988305e-09, 1.988305e-09, ..., 1.988305e-09, 1.988305e-09], [2.006311e-09, 2.006262e-09, ..., 2.006110e-09, 2.006241e-09], ..., [2.173153e-09, 2.170129e-09, ..., 2.183396e-09, 2.176948e-09], [2.144384e-09, 2.144384e-09, ..., 2.144384e-09, 2.144384e-09]]], dtype=float32) - BURDENDUST(time, lat, lon)float32...
- units :
- kg/m2
- long_name :
- Dust aerosol burden
- cell_methods :
- time: mean
array([[[7.725906e-19, 7.725906e-19, ..., 7.725906e-19, 7.725906e-19], [7.743372e-19, 7.740883e-19, ..., 7.746451e-19, 7.745245e-19], ..., [7.030139e-19, 7.031753e-19, ..., 7.027957e-19, 7.029559e-19], [7.158529e-19, 7.158529e-19, ..., 7.158529e-19, 7.158529e-19]]], dtype=float32) - BURDENPOM(time, lat, lon)float32...
- units :
- kg/m2
- long_name :
- POM aerosol burden
- cell_methods :
- time: mean
array([[[2.143579e-08, 2.143579e-08, ..., 2.143579e-08, 2.143579e-08], [2.165283e-08, 2.165151e-08, ..., 2.165192e-08, 2.165266e-08], ..., [2.174790e-08, 2.174653e-08, ..., 2.175271e-08, 2.174840e-08], [2.172848e-08, 2.172848e-08, ..., 2.172848e-08, 2.172848e-08]]], dtype=float32) - BURDENSEASALT(time, lat, lon)float32...
- units :
- kg/m2
- long_name :
- Seasalt aerosol burden
- cell_methods :
- time: mean
array([[[5.329387e-06, 5.329362e-06, ..., 5.329387e-06, 5.329388e-06], [3.996685e-06, 4.037484e-06, ..., 3.890546e-06, 3.936382e-06], ..., [5.691949e-06, 5.795359e-06, ..., 5.507011e-06, 5.593296e-06], [6.638254e-06, 6.638251e-06, ..., 6.638301e-06, 6.638254e-06]]], dtype=float32) - BURDENSO4(time, lat, lon)float32...
- units :
- kg/m2
- long_name :
- Sulfate aerosol burden
- cell_methods :
- time: mean
array([[[1.832569e-07, 1.832566e-07, ..., 1.832569e-07, 1.832569e-07], [1.786469e-07, 1.796265e-07, ..., 1.769562e-07, 1.779845e-07], ..., [1.343248e-07, 1.339743e-07, ..., 1.356278e-07, 1.348629e-07], [1.328762e-07, 1.328762e-07, ..., 1.328761e-07, 1.328762e-07]]], dtype=float32) - BURDENSOA(time, lat, lon)float32...
- units :
- kg/m2
- long_name :
- SOA aerosol burden
- cell_methods :
- time: mean
array([[[1.143297e-07, 1.143297e-07, ..., 1.143297e-07, 1.143297e-07], [1.152942e-07, 1.152891e-07, ..., 1.152881e-07, 1.152922e-07], ..., [1.180416e-07, 1.180643e-07, ..., 1.179794e-07, 1.180125e-07], [1.184918e-07, 1.184918e-07, ..., 1.184918e-07, 1.184918e-07]]], dtype=float32) - CCN3(time, lev, lat, lon)float32...
- mdims :
- 1
- units :
- #/cm3
- long_name :
- CCN concentration at S=0.1%
- cell_methods :
- time: mean
[414720 values with dtype=float32]
- CDNUMC(time, lat, lon)float32...
- units :
- 1/m2
- long_name :
- Vertically-integrated droplet concentration
- cell_methods :
- time: mean
array([[[5.356734e+07, 5.356573e+07, ..., 5.356834e+07, 5.356829e+07], [3.471890e+07, 3.706080e+07, ..., 3.200395e+07, 3.047488e+07], ..., [1.651273e+08, 2.397460e+08, ..., 1.925994e+08, 2.354427e+08], [1.600952e+08, 1.600971e+08, ..., 1.600895e+08, 1.600916e+08]]], dtype=float32) - CLDHGH(time, lat, lon)float32...
- units :
- fraction
- long_name :
- Vertically-integrated high cloud
- cell_methods :
- time: mean
array([[[0.328903, 0.328902, ..., 0.328903, 0.328903], [0.337123, 0.359012, ..., 0.299753, 0.31428 ], ..., [0.208326, 0.204549, ..., 0.213732, 0.212031], [0.368617, 0.368617, ..., 0.368617, 0.368617]]], dtype=float32) - CLDICE(time, lev, lat, lon)float32...
- mdims :
- 1
- units :
- kg/kg
- long_name :
- Grid box averaged cloud ice amount
- cell_methods :
- time: mean
[414720 values with dtype=float32]
- CLDLIQ(time, lev, lat, lon)float32...
- mdims :
- 1
- units :
- kg/kg
- long_name :
- Grid box averaged cloud liquid amount
- cell_methods :
- time: mean
[414720 values with dtype=float32]
- CLDLOW(time, lat, lon)float32...
- units :
- fraction
- long_name :
- Vertically-integrated low cloud
- cell_methods :
- time: mean
array([[[0.520363, 0.520358, ..., 0.520366, 0.520365], [0.588114, 0.584586, ..., 0.575076, 0.589623], ..., [0.57067 , 0.573495, ..., 0.584121, 0.57418 ], [0.606201, 0.606201, ..., 0.606074, 0.606188]]], dtype=float32) - CLDMED(time, lat, lon)float32...
- units :
- fraction
- long_name :
- Vertically-integrated mid-level cloud
- cell_methods :
- time: mean
array([[[0.572397, 0.572398, ..., 0.572397, 0.572397], [0.687043, 0.701576, ..., 0.652557, 0.666853], ..., [0.58474 , 0.588883, ..., 0.567275, 0.574238], [0.56688 , 0.56688 , ..., 0.56688 , 0.56688 ]]], dtype=float32) - CLDTOT(time, lat, lon)float32...
- units :
- fraction
- long_name :
- Vertically-integrated total cloud
- cell_methods :
- time: mean
array([[[0.770504, 0.770499, ..., 0.770507, 0.770505], [0.832277, 0.840765, ..., 0.812999, 0.824922], ..., [0.775441, 0.781654, ..., 0.769911, 0.76855 ], [0.816459, 0.816459, ..., 0.816398, 0.816447]]], dtype=float32) - CLOUD(time, lev, lat, lon)float32...
- mdims :
- 1
- units :
- fraction
- long_name :
- Cloud fraction
- cell_methods :
- time: mean
[414720 values with dtype=float32]
- DCQ(time, lev, lat, lon)float32...
- mdims :
- 1
- units :
- kg/kg/s
- long_name :
- Q tendency due to moist processes
- cell_methods :
- time: mean
[414720 values with dtype=float32]
- DMS_SRF(time, lat, lon)float32...
- units :
- kg/kg
- long_name :
- DMS in bottom layer
- cell_methods :
- time: mean
array([[[1.294095e-12, 1.294094e-12, ..., 1.294094e-12, 1.294094e-12], [7.402408e-13, 7.582291e-13, ..., 7.066382e-13, 7.228144e-13], ..., [3.256227e-14, 3.253629e-14, ..., 3.283203e-14, 3.265065e-14], [3.758881e-14, 3.758881e-14, ..., 3.758862e-14, 3.758881e-14]]], dtype=float32) - DTCOND(time, lev, lat, lon)float32...
- mdims :
- 1
- units :
- K/s
- long_name :
- T tendency - moist processes
- cell_methods :
- time: mean
[414720 values with dtype=float32]
- DTV(time, lev, lat, lon)float32...
- mdims :
- 1
- units :
- K/s
- long_name :
- T vertical diffusion
- cell_methods :
- time: mean
[414720 values with dtype=float32]
- EMISCLD(time, lev, lat, lon)float32...
- mdims :
- 1
- units :
- 1
- long_name :
- cloud emissivity
- cell_methods :
- time: mean
[414720 values with dtype=float32]
- FICE(time, lev, lat, lon)float32...
- mdims :
- 1
- units :
- fraction
- long_name :
- Fractional ice content within cloud
- cell_methods :
- time: mean
[414720 values with dtype=float32]
- FLDS(time, lat, lon)float32...
- Sampling_Sequence :
- rad_lwsw
- units :
- W/m2
- long_name :
- Downwelling longwave flux at surface
- cell_methods :
- time: mean
array([[[236.2583 , 236.2545 , ..., 236.2602 , 236.25775], [235.4267 , 235.73302, ..., 235.57033, 235.434 ], ..., [236.19444, 237.02942, ..., 235.64937, 235.66736], [238.50641, 238.50766, ..., 238.46606, 238.48714]]], dtype=float32) - FLNS(time, lat, lon)float32...
- Sampling_Sequence :
- rad_lwsw
- units :
- W/m2
- long_name :
- Net longwave flux at surface
- cell_methods :
- time: mean
array([[[79.3983 , 79.40211 , ..., 79.39641 , 79.39886 ], [80.2299 , 79.92358 , ..., 80.08627 , 80.222595], ..., [79.46216 , 78.62718 , ..., 80.00724 , 79.98925 ], [77.15022 , 77.14897 , ..., 77.19055 , 77.16949 ]]], dtype=float32) - FLNSC(time, lat, lon)float32...
- Sampling_Sequence :
- rad_lwsw
- units :
- W/m2
- long_name :
- Clearsky net longwave flux at surface
- cell_methods :
- time: mean
array([[[109.59436 , 109.59431 , ..., 109.59435 , 109.59435 ], [110.38511 , 110.38359 , ..., 110.37226 , 110.366066], ..., [108.88084 , 108.82101 , ..., 109.02294 , 108.94216 ], [108.05325 , 108.053246, ..., 108.053 , 108.05322 ]]], dtype=float32) - FLNT(time, lat, lon)float32...
- Sampling_Sequence :
- rad_lwsw
- units :
- W/m2
- long_name :
- Net longwave flux at top of model
- cell_methods :
- time: mean
array([[[195.13887, 195.13979, ..., 195.1388 , 195.13907], [193.65504, 193.08711, ..., 194.31952, 193.94109], ..., [196.7363 , 196.14072, ..., 196.9263 , 197.13918], [195.31691, 195.3155 , ..., 195.33676, 195.3262 ]]], dtype=float32) - FLNTC(time, lat, lon)float32...
- Sampling_Sequence :
- rad_lwsw
- units :
- W/m2
- long_name :
- Clearsky net longwave flux at top of model
- cell_methods :
- time: mean
array([[[215.04306, 215.04308, ..., 215.04306, 215.04305], [214.82903, 214.82837, ..., 214.8546 , 214.83884], ..., [214.629 , 214.62831, ..., 214.63046, 214.63351], [214.54453, 214.54454, ..., 214.5446 , 214.54456]]], dtype=float32) - FLUT(time, lat, lon)float32...
- Sampling_Sequence :
- rad_lwsw
- units :
- W/m2
- long_name :
- Upwelling longwave flux at top of model
- cell_methods :
- time: mean
array([[[195.98311, 195.98402, ..., 195.98303, 195.9833 ], [194.49588, 193.92807, ..., 195.16014, 194.78181], ..., [197.4796 , 196.88426, ..., 197.66916, 197.88225], [196.06256, 196.06114, ..., 196.08241, 196.07185]]], dtype=float32) - FLUTC(time, lat, lon)float32...
- Sampling_Sequence :
- rad_lwsw
- units :
- W/m2
- long_name :
- Clearsky upwelling longwave flux at top of model
- cell_methods :
- time: mean
array([[[215.8873 , 215.8873 , ..., 215.88728, 215.88728], [215.66986, 215.66933, ..., 215.69522, 215.67957], ..., [215.3723 , 215.37186, ..., 215.3733 , 215.37659], [215.29018, 215.29018, ..., 215.29024, 215.2902 ]]], dtype=float32) - FREQI(time, lev, lat, lon)float32...
- mdims :
- 1
- units :
- fraction
- long_name :
- Fractional occurrence of ice
- cell_methods :
- time: mean
[414720 values with dtype=float32]
- FREQL(time, lev, lat, lon)float32...
- mdims :
- 1
- units :
- fraction
- long_name :
- Fractional occurrence of liquid
- cell_methods :
- time: mean
[414720 values with dtype=float32]
- FREQR(time, lev, lat, lon)float32...
- mdims :
- 1
- units :
- fraction
- long_name :
- Fractional occurrence of rain
- cell_methods :
- time: mean
[414720 values with dtype=float32]
- FREQS(time, lev, lat, lon)float32...
- mdims :
- 1
- units :
- fraction
- long_name :
- Fractional occurrence of snow
- cell_methods :
- time: mean
[414720 values with dtype=float32]
- FSDS(time, lat, lon)float32...
- Sampling_Sequence :
- rad_lwsw
- units :
- W/m2
- long_name :
- Downwelling solar flux at surface
- cell_methods :
- time: mean
array([[[0.245982, 0.245978, ..., 0.245988, 0.245987], [3.980691, 3.960923, ..., 4.073747, 4.038969], ..., [4.058327, 4.003556, ..., 3.960577, 4.027647], [0.24733 , 0.247331, ..., 0.247336, 0.24733 ]]], dtype=float32) - FSDSC(time, lat, lon)float32...
- Sampling_Sequence :
- rad_lwsw
- units :
- W/m2
- long_name :
- Clearsky downwelling solar flux at surface
- cell_methods :
- time: mean
array([[[0.295496, 0.295496, ..., 0.295496, 0.295496], [5.334999, 5.337223, ..., 5.309964, 5.324929], ..., [5.27583 , 5.263911, ..., 5.288335, 5.282058], [0.293849, 0.293849, ..., 0.293849, 0.293849]]], dtype=float32) - FSNS(time, lat, lon)float32...
- Sampling_Sequence :
- rad_lwsw
- units :
- W/m2
- long_name :
- Net solar flux at surface
- cell_methods :
- time: mean
array([[[0.230643, 0.230639, ..., 0.230649, 0.230648], [3.568191, 3.548002, ..., 3.61177 , 3.613356], ..., [3.612418, 3.572529, ..., 3.544353, 3.584759], [0.232155, 0.232157, ..., 0.232161, 0.232155]]], dtype=float32) - FSNSC(time, lat, lon)float32...
- Sampling_Sequence :
- rad_lwsw
- units :
- W/m2
- long_name :
- Clearsky net solar flux at surface
- cell_methods :
- time: mean
array([[[0.275672, 0.275672, ..., 0.275672, 0.275672], [4.283006, 4.283292, ..., 4.263573, 4.276045], ..., [4.259212, 4.251546, ..., 4.262729, 4.26043 ], [0.274513, 0.274513, ..., 0.274512, 0.274513]]], dtype=float32) - FSNT(time, lat, lon)float32...
- Sampling_Sequence :
- rad_lwsw
- units :
- W/m2
- long_name :
- Net solar flux at top of model
- cell_methods :
- time: mean
array([[[0.630925, 0.630922, ..., 0.630927, 0.630926], [8.233937, 8.205184, ..., 8.307201, 8.300164], ..., [8.369527, 8.322571, ..., 8.261292, 8.320506], [0.63259 , 0.632591, ..., 0.632564, 0.632591]]], dtype=float32) - FSNTC(time, lat, lon)float32...
- Sampling_Sequence :
- rad_lwsw
- units :
- W/m2
- long_name :
- Clearsky net solar flux at top of model
- cell_methods :
- time: mean
array([[[0.687178, 0.687178, ..., 0.687178, 0.687178], [9.52981 , 9.521612, ..., 9.493626, 9.520573], ..., [9.525313, 9.515963, ..., 9.516292, 9.518753], [0.687258, 0.687258, ..., 0.68726 , 0.687258]]], dtype=float32) - FSNTOA(time, lat, lon)float32...
- Sampling_Sequence :
- rad_lwsw
- units :
- W/m2
- long_name :
- Net solar flux at top of atmosphere
- cell_methods :
- time: mean
array([[[0.75778 , 0.757776, ..., 0.757782, 0.75778 ], [8.645436, 8.614544, ..., 8.717927, 8.711913], ..., [8.779806, 8.733135, ..., 8.665559, 8.728642], [0.759202, 0.759204, ..., 0.759176, 0.759203]]], dtype=float32) - FSNTOAC(time, lat, lon)float32...
- Sampling_Sequence :
- rad_lwsw
- units :
- W/m2
- long_name :
- Clearsky net solar flux at top of atmosphere
- cell_methods :
- time: mean
array([[[0.814024, 0.814024, ..., 0.814024, 0.814024], [9.941079, 9.93073 , ..., 9.904143, 9.932112], ..., [9.93539 , 9.926318, ..., 9.920329, 9.926677], [0.813863, 0.813863, ..., 0.813865, 0.813863]]], dtype=float32) - FSUTOA(time, lat, lon)float32...
- Sampling_Sequence :
- rad_lwsw
- units :
- W/m2
- long_name :
- Upwelling solar flux at top of atmosphere
- cell_methods :
- time: mean
array([[[0.42931 , 0.429313, ..., 0.429308, 0.429309], [5.874749, 5.891879, ..., 5.746892, 5.794396], ..., [5.74026 , 5.773168, ..., 5.831485, 5.777547], [0.427266, 0.427264, ..., 0.427292, 0.427265]]], dtype=float32) - H2O2_SRF(time, lat, lon)float32...
- units :
- kg/kg
- long_name :
- H2O2 in bottom layer
- cell_methods :
- time: mean
array([[[4.904283e-10, 4.904277e-10, ..., 4.904286e-10, 4.904285e-10], [4.918842e-10, 4.925317e-10, ..., 4.921735e-10, 4.916560e-10], ..., [4.525178e-13, 4.518309e-13, ..., 4.557930e-13, 4.537680e-13], [5.218865e-13, 5.218864e-13, ..., 5.218782e-13, 5.218868e-13]]], dtype=float32) - H2SO4_SRF(time, lat, lon)float32...
- units :
- kg/kg
- long_name :
- H2SO4 in bottom layer
- cell_methods :
- time: mean
array([[[5.071150e-14, 5.070950e-14, ..., 5.071238e-14, 5.071161e-14], [4.734167e-14, 4.778410e-14, ..., 4.702767e-14, 4.710677e-14], ..., [1.451902e-16, 1.379874e-16, ..., 1.690081e-16, 1.559626e-16], [1.004976e-16, 1.004976e-16, ..., 1.004951e-16, 1.004977e-16]]], dtype=float32) - ICEFRAC(time, lat, lon)float32...
- units :
- fraction
- long_name :
- Fraction of sfc area covered by sea-ice
- cell_methods :
- time: mean
array([[[0., 0., ..., 0., 0.], [0., 0., ..., 0., 0.], ..., [0., 0., ..., 0., 0.], [0., 0., ..., 0., 0.]]], dtype=float32) - ICIMR(time, lev, lat, lon)float32...
- mdims :
- 1
- units :
- kg/kg
- long_name :
- Prognostic in-cloud ice mixing ratio
- cell_methods :
- time: mean
[414720 values with dtype=float32]
- ICWMR(time, lev, lat, lon)float32...
- mdims :
- 1
- units :
- kg/kg
- long_name :
- Prognostic in-cloud water mixing ratio
- cell_methods :
- time: mean
[414720 values with dtype=float32]
- IWC(time, lev, lat, lon)float32...
- mdims :
- 1
- units :
- kg/m3
- long_name :
- Grid box average ice water content
- cell_methods :
- time: mean
[414720 values with dtype=float32]
- LANDFRAC(time, lat, lon)float32...
- units :
- fraction
- long_name :
- Fraction of sfc area covered by land
- cell_methods :
- time: mean
array([[[0., 0., ..., 0., 0.], [0., 0., ..., 0., 0.], ..., [0., 0., ..., 0., 0.], [0., 0., ..., 0., 0.]]], dtype=float32) - LHFLX(time, lat, lon)float32...
- units :
- W/m2
- long_name :
- Surface latent heat flux
- cell_methods :
- time: mean
array([[[32.333347, 32.333096, ..., 32.333195, 32.333298], [30.9613 , 31.033855, ..., 30.821238, 30.874454], ..., [35.825184, 35.980236, ..., 35.50312 , 35.661602], [34.324028, 34.324043, ..., 34.323067, 34.324043]]], dtype=float32) - LWCF(time, lat, lon)float32...
- Sampling_Sequence :
- rad_lwsw
- units :
- W/m2
- long_name :
- Longwave cloud forcing
- cell_methods :
- time: mean
array([[[19.904186, 19.903286, ..., 19.904253, 19.90399 ], [21.17397 , 21.741255, ..., 20.535082, 20.897749], ..., [17.892706, 18.48759 , ..., 17.704157, 17.494347], [19.227621, 19.22903 , ..., 19.207838, 19.218351]]], dtype=float32) - NUMICE(time, lev, lat, lon)float32...
- mdims :
- 1
- units :
- 1/kg
- long_name :
- Grid box averaged cloud ice number
- cell_methods :
- time: mean
[414720 values with dtype=float32]
- NUMLIQ(time, lev, lat, lon)float32...
- mdims :
- 1
- units :
- 1/kg
- long_name :
- Grid box averaged cloud liquid number
- cell_methods :
- time: mean
[414720 values with dtype=float32]
- OCNFRAC(time, lat, lon)float32...
- units :
- fraction
- long_name :
- Fraction of sfc area covered by ocean
- cell_methods :
- time: mean
array([[[1., 1., ..., 1., 1.], [1., 1., ..., 1., 1.], ..., [1., 1., ..., 1., 1.], [1., 1., ..., 1., 1.]]], dtype=float32) - OMEGA(time, lev, lat, lon)float32...
- mdims :
- 1
- units :
- Pa/s
- long_name :
- Vertical velocity (pressure)
- cell_methods :
- time: mean
[414720 values with dtype=float32]
- OMEGAT(time, lev, lat, lon)float32...
- mdims :
- 1
- units :
- K Pa/s
- long_name :
- Vertical heat flux
- cell_methods :
- time: mean
[414720 values with dtype=float32]
- ORO(time, lat, lon)float32...
- units :
- frac
- long_name :
- ORO
- cell_methods :
- time: mean
array([[[0., 0., ..., 0., 0.], [0., 0., ..., 0., 0.], ..., [0., 0., ..., 0., 0.], [0., 0., ..., 0., 0.]]], dtype=float32) - PBLH(time, lat, lon)float32...
- units :
- m
- long_name :
- PBL height
- cell_methods :
- time: mean
array([[[716.9715 , 716.6867 , ..., 716.9715 , 716.9715 ], [697.4105 , 697.4573 , ..., 694.87885, 695.27136], ..., [701.3416 , 695.27704, ..., 711.9383 , 708.8251 ], [668.96344, 668.96344, ..., 668.537 , 668.83575]]], dtype=float32) - PHIS(time, lat, lon)float32...
- units :
- m2/s2
- long_name :
- Surface geopotential
array([[[0., 0., ..., 0., 0.], [0., 0., ..., 0., 0.], ..., [0., 0., ..., 0., 0.], [0., 0., ..., 0., 0.]]], dtype=float32) - PRECC(time, lat, lon)float32...
- units :
- m/s
- long_name :
- Convective precipitation rate (liq + ice)
- cell_methods :
- time: mean
array([[[1.342837e-08, 1.342845e-08, ..., 1.342850e-08, 1.342842e-08], [1.282507e-08, 1.303026e-08, ..., 1.256107e-08, 1.268600e-08], ..., [1.170913e-08, 1.194004e-08, ..., 1.136746e-08, 1.157337e-08], [1.370993e-08, 1.370998e-08, ..., 1.370973e-08, 1.370983e-08]]], dtype=float32) - PRECL(time, lat, lon)float32...
- units :
- m/s
- long_name :
- Large-scale (stable) precipitation rate (liq + ice)
- cell_methods :
- time: mean
array([[[6.251593e-10, 6.250012e-10, ..., 6.246573e-10, 6.250196e-10], [7.413523e-10, 7.326830e-10, ..., 7.347091e-10, 7.605457e-10], ..., [6.442626e-10, 7.144561e-10, ..., 6.351671e-10, 6.296276e-10], [7.661470e-10, 7.660239e-10, ..., 7.595183e-10, 7.658655e-10]]], dtype=float32) - PRECSC(time, lat, lon)float32...
- units :
- m/s
- long_name :
- Convective snow rate (water equivalent)
- cell_methods :
- time: mean
array([[[1.342823e-08, 1.342831e-08, ..., 1.342836e-08, 1.342828e-08], [1.282493e-08, 1.303002e-08, ..., 1.256091e-08, 1.268585e-08], ..., [1.170795e-08, 1.193892e-08, ..., 1.136592e-08, 1.157179e-08], [1.370967e-08, 1.370973e-08, ..., 1.370947e-08, 1.370958e-08]]], dtype=float32) - PRECSL(time, lat, lon)float32...
- units :
- m/s
- long_name :
- Large-scale (stable) snow rate (water equivalent)
- cell_methods :
- time: mean
array([[[6.251591e-10, 6.250010e-10, ..., 6.246572e-10, 6.250194e-10], [7.412523e-10, 7.326735e-10, ..., 7.347019e-10, 7.605316e-10], ..., [6.442047e-10, 7.143890e-10, ..., 6.350811e-10, 6.295681e-10], [7.660665e-10, 7.659434e-10, ..., 7.594378e-10, 7.657850e-10]]], dtype=float32) - PS(time, lat, lon)float32...
- units :
- Pa
- long_name :
- Surface pressure
- cell_methods :
- time: mean
array([[[104161.61 , 104161.61 , ..., 104161.61 , 104161.61 ], [104154.04 , 104149.52 , ..., 104161.54 , 104158.16 ], ..., [104203.375, 104197.76 , ..., 104214.016, 104208.87 ], [104049.055, 104049.055, ..., 104049.055, 104049.055]]], dtype=float32) - PSL(time, lat, lon)float32...
- units :
- Pa
- long_name :
- Sea level pressure
- cell_methods :
- time: mean
array([[[104161.61 , 104161.61 , ..., 104161.61 , 104161.61 ], [104154.04 , 104149.52 , ..., 104161.54 , 104158.16 ], ..., [104203.375, 104197.76 , ..., 104214.016, 104208.87 ], [104049.055, 104049.055, ..., 104049.055, 104049.055]]], dtype=float32) - Q(time, lev, lat, lon)float32...
- mdims :
- 1
- units :
- kg/kg
- long_name :
- Specific humidity
- cell_methods :
- time: mean
[414720 values with dtype=float32]
- QFLX(time, lat, lon)float32...
- units :
- kg/m2/s
- long_name :
- Surface water flux
- cell_methods :
- time: mean
array([[[1.292817e-05, 1.292807e-05, ..., 1.292811e-05, 1.292815e-05], [1.237957e-05, 1.240858e-05, ..., 1.232356e-05, 1.234484e-05], ..., [1.432434e-05, 1.438634e-05, ..., 1.419557e-05, 1.425894e-05], [1.372412e-05, 1.372413e-05, ..., 1.372374e-05, 1.372413e-05]]], dtype=float32) - QREFHT(time, lat, lon)float32...
- units :
- kg/kg
- long_name :
- Reference height humidity
- cell_methods :
- time: mean
array([[[0.002177, 0.002177, ..., 0.002177, 0.002177], [0.002147, 0.002149, ..., 0.002148, 0.002149], ..., [0.002238, 0.002242, ..., 0.002227, 0.002233], [0.002323, 0.002323, ..., 0.002323, 0.002323]]], dtype=float32) - QRL(time, lev, lat, lon)float32...
- mdims :
- 1
- Sampling_Sequence :
- rad_lwsw
- units :
- K/s
- long_name :
- Longwave heating rate
- cell_methods :
- time: mean
[414720 values with dtype=float32]
- QRS(time, lev, lat, lon)float32...
- mdims :
- 1
- Sampling_Sequence :
- rad_lwsw
- units :
- K/s
- long_name :
- Solar heating rate
- cell_methods :
- time: mean
[414720 values with dtype=float32]
- RELHUM(time, lev, lat, lon)float32...
- mdims :
- 1
- units :
- percent
- long_name :
- Relative humidity
- cell_methods :
- time: mean
[414720 values with dtype=float32]
- SHFLX(time, lat, lon)float32...
- units :
- W/m2
- long_name :
- Surface sensible heat flux
- cell_methods :
- time: mean
array([[[15.580022, 15.580074, ..., 15.580058, 15.58002 ], [15.709043, 15.729114, ..., 15.727243, 15.705076], ..., [16.036852, 16.013294, ..., 16.102547, 16.066706], [15.852605, 15.852625, ..., 15.852766, 15.852571]]], dtype=float32) - SNOWHICE(time, lat, lon)float32...
- units :
- m
- long_name :
- Snow depth over ice
- cell_methods :
- time: mean
array([[[0., 0., ..., 0., 0.], [0., 0., ..., 0., 0.], ..., [0., 0., ..., 0., 0.], [0., 0., ..., 0., 0.]]], dtype=float32) - SNOWHLND(time, lat, lon)float32...
- units :
- m
- long_name :
- Water equivalent snow depth
- cell_methods :
- time: mean
array([[[0., 0., ..., 0., 0.], [0., 0., ..., 0., 0.], ..., [0., 0., ..., 0., 0.], [0., 0., ..., 0., 0.]]], dtype=float32) - SO2_SRF(time, lat, lon)float32...
- units :
- kg/kg
- long_name :
- SO2 in bottom layer
- cell_methods :
- time: mean
array([[[8.285143e-12, 8.285146e-12, ..., 8.285150e-12, 8.285148e-12], [8.696828e-12, 8.818730e-12, ..., 8.481422e-12, 8.584060e-12], ..., [8.721605e-12, 8.520038e-12, ..., 9.480641e-12, 9.018539e-12], [5.814717e-12, 5.814718e-12, ..., 5.814706e-12, 5.814717e-12]]], dtype=float32) - SOAG_SRF(time, lat, lon)float32...
- units :
- kg/kg
- long_name :
- SOAG in bottom layer
- cell_methods :
- time: mean
array([[[1.106262e-13, 1.106262e-13, ..., 1.106264e-13, 1.106263e-13], [9.816152e-14, 9.908202e-14, ..., 9.613233e-14, 9.714031e-14], ..., [3.042909e-13, 3.040246e-13, ..., 3.043737e-13, 3.046026e-13], [3.255289e-13, 3.255291e-13, ..., 3.255455e-13, 3.255277e-13]]], dtype=float32) - SOLIN(time, lat, lon)float32...
- Sampling_Sequence :
- rad_lwsw
- units :
- W/m2
- long_name :
- Solar insolation
- cell_methods :
- time: mean
array([[[ 1.187088, 1.187088, ..., 1.187088, 1.187088], [14.520164, 14.5064 , ..., 14.464797, 14.506287], ..., [14.520043, 14.50628 , ..., 14.497022, 14.506167], [ 1.186466, 1.186466, ..., 1.186466, 1.186466]]], dtype=float32) - SWCF(time, lat, lon)float32...
- Sampling_Sequence :
- rad_lwsw
- units :
- W/m2
- long_name :
- Shortwave cloud forcing
- cell_methods :
- time: mean
array([[[-0.056244, -0.056248, ..., -0.056242, -0.056244], [-1.295643, -1.316187, ..., -1.186216, -1.220199], ..., [-1.155583, -1.193184, ..., -1.25477 , -1.198034], [-0.054661, -0.054659, ..., -0.054688, -0.05466 ]]], dtype=float32) - T(time, lev, lat, lon)float32...
- mdims :
- 1
- units :
- K
- long_name :
- Temperature
- cell_methods :
- time: mean
[414720 values with dtype=float32]
- TAUX(time, lat, lon)float32...
- units :
- N/m2
- long_name :
- Zonal surface stress
- cell_methods :
- time: mean
array([[[-0.002954, -0.002341, ..., -0.004164, -0.003562], [ 0.003288, 0.004154, ..., 0.00158 , 0.002429], ..., [-0.030015, -0.029421, ..., -0.03083 , -0.030482], [-0.037321, -0.036382, ..., -0.038984, -0.038189]]], dtype=float32) - TAUY(time, lat, lon)float32...
- units :
- N/m2
- long_name :
- Meridional surface stress
- cell_methods :
- time: mean
array([[[-0.014007, -0.014122, ..., -0.013696, -0.013865], [-0.016014, -0.016086, ..., -0.015748, -0.015897], ..., [ 0.027693, 0.029742, ..., 0.023464, 0.025591], [ 0.020709, 0.022318, ..., 0.017378, 0.019062]]], dtype=float32) - TGCLDCWP(time, lat, lon)float32...
- units :
- kg/m2
- long_name :
- Total grid-box cloud water path (liquid and ice)
- cell_methods :
- time: mean
array([[[0.018188, 0.018184, ..., 0.018188, 0.018189], [0.017161, 0.017168, ..., 0.017509, 0.017033], ..., [0.015634, 0.015847, ..., 0.015118, 0.015326], [0.017305, 0.017304, ..., 0.017265, 0.01731 ]]], dtype=float32) - TGCLDIWP(time, lat, lon)float32...
- units :
- kg/m2
- long_name :
- Total grid-box cloud ice water path
- cell_methods :
- time: mean
array([[[0.017937, 0.017937, ..., 0.017941, 0.017942], [0.01629 , 0.016324, ..., 0.016559, 0.016206], ..., [0.014749, 0.014935, ..., 0.014385, 0.014419], [0.016465, 0.016461, ..., 0.016423, 0.016467]]], dtype=float32) - TGCLDLWP(time, lat, lon)float32...
- units :
- kg/m2
- long_name :
- Total grid-box cloud liquid water path
- cell_methods :
- time: mean
array([[[0.000251, 0.000247, ..., 0.000247, 0.000246], [0.000871, 0.000844, ..., 0.00095 , 0.000827], ..., [0.000886, 0.000912, ..., 0.000733, 0.000908], [0.00084 , 0.000842, ..., 0.000843, 0.000843]]], dtype=float32) - TMQ(time, lat, lon)float32...
- units :
- kg/m2
- long_name :
- Total (vertically integrated) precipitable water
- cell_methods :
- time: mean
array([[[4.346092, 4.346092, ..., 4.346093, 4.346092], [4.252241, 4.250264, ..., 4.252882, 4.25476 ], ..., [4.465926, 4.474147, ..., 4.448967, 4.457271], [4.561546, 4.561547, ..., 4.561563, 4.561547]]], dtype=float32) - TREFHT(time, lat, lon)float32...
- units :
- K
- long_name :
- Reference height temperature
- cell_methods :
- time: mean
array([[[271.34036, 271.34033, ..., 271.34033, 271.34036], [271.1618 , 271.16635, ..., 271.15054, 271.15707], ..., [271.43607, 271.4451 , ..., 271.41315, 271.42523], [271.54703, 271.54703, ..., 271.547 , 271.54703]]], dtype=float32) - TS(time, lat, lon)float32...
- units :
- K
- long_name :
- Surface temperature (radiative)
- cell_methods :
- time: mean
array([[[273.15, 273.15, ..., 273.15, 273.15], [273.15, 273.15, ..., 273.15, 273.15], ..., [273.15, 273.15, ..., 273.15, 273.15], [273.15, 273.15, ..., 273.15, 273.15]]], dtype=float32) - TSMN(time, lat, lon)float32...
- units :
- K
- long_name :
- Minimum surface temperature over output period
- cell_methods :
- time: minimum
array([[[273.15, 273.15, ..., 273.15, 273.15], [273.15, 273.15, ..., 273.15, 273.15], ..., [273.15, 273.15, ..., 273.15, 273.15], [273.15, 273.15, ..., 273.15, 273.15]]], dtype=float32) - TSMX(time, lat, lon)float32...
- units :
- K
- long_name :
- Maximum surface temperature over output period
- cell_methods :
- time: maximum
array([[[273.15, 273.15, ..., 273.15, 273.15], [273.15, 273.15, ..., 273.15, 273.15], ..., [273.15, 273.15, ..., 273.15, 273.15], [273.15, 273.15, ..., 273.15, 273.15]]], dtype=float32) - U(time, lev, lat, lon)float32...
- mdims :
- 1
- units :
- m/s
- long_name :
- Zonal wind
- cell_methods :
- time: mean
[414720 values with dtype=float32]
- U10(time, lat, lon)float32...
- units :
- m/s
- long_name :
- 10m wind speed
- cell_methods :
- time: mean
array([[[5.24262 , 5.242611, ..., 5.242607, 5.242615], [4.735405, 4.755939, ..., 4.709074, 4.719904], ..., [6.004458, 6.042439, ..., 5.922496, 5.964405], [6.206009, 6.206014, ..., 6.205991, 6.205987]]], dtype=float32) - UU(time, lev, lat, lon)float32...
- mdims :
- 1
- units :
- m2/s2
- long_name :
- Zonal velocity squared
- cell_methods :
- time: mean
[414720 values with dtype=float32]
- V(time, lev, lat, lon)float32...
- mdims :
- 1
- units :
- m/s
- long_name :
- Meridional wind
- cell_methods :
- time: mean
[414720 values with dtype=float32]
- VD01(time, lev, lat, lon)float32...
- mdims :
- 1
- units :
- kg/kg/s
- long_name :
- Vertical diffusion of Q
- cell_methods :
- time: mean
[414720 values with dtype=float32]
- VQ(time, lev, lat, lon)float32...
- mdims :
- 1
- units :
- m/skg/kg
- long_name :
- Meridional water transport
- cell_methods :
- time: mean
[414720 values with dtype=float32]
- VT(time, lev, lat, lon)float32...
- mdims :
- 1
- units :
- K m/s
- long_name :
- Meridional heat transport
- cell_methods :
- time: mean
[414720 values with dtype=float32]
- VU(time, lev, lat, lon)float32...
- mdims :
- 1
- units :
- m2/s2
- long_name :
- Meridional flux of zonal momentum
- cell_methods :
- time: mean
[414720 values with dtype=float32]
- VV(time, lev, lat, lon)float32...
- mdims :
- 1
- units :
- m2/s2
- long_name :
- Meridional velocity squared
- cell_methods :
- time: mean
[414720 values with dtype=float32]
- WGUSTD(time, lat, lon)float32...
- units :
- m/s
- long_name :
- wind gusts from turbulence
- cell_methods :
- time: mean
array([[[0.329975, 0.329962, ..., 0.329963, 0.329971], [0.318051, 0.316907, ..., 0.319593, 0.318248], ..., [0.341423, 0.34224 , ..., 0.341468, 0.342049], [0.332505, 0.332492, ..., 0.33259 , 0.332533]]], dtype=float32) - WSUB(time, lev, lat, lon)float32...
- mdims :
- 1
- units :
- m/s
- long_name :
- Diagnostic sub-grid vertical velocity
- cell_methods :
- time: mean
[414720 values with dtype=float32]
- Z3(time, lev, lat, lon)float32...
- mdims :
- 1
- units :
- m
- long_name :
- Geopotential Height (above sea level)
- cell_methods :
- time: mean
[414720 values with dtype=float32]
- bc_a1_SRF(time, lat, lon)float32...
- units :
- kg/kg
- long_name :
- bc_a1 in bottom layer
- cell_methods :
- time: mean
array([[[1.831362e-15, 1.831473e-15, ..., 1.831402e-15, 1.831372e-15], [1.515153e-15, 1.526499e-15, ..., 1.492517e-15, 1.505338e-15], ..., [3.456931e-14, 3.259835e-14, ..., 4.178743e-14, 3.766082e-14], [2.994062e-14, 2.994071e-14, ..., 2.994333e-14, 2.994069e-14]]], dtype=float32) - dst_a1SF(time, lat, lon)float32...
- units :
- kg/m2/s
- long_name :
- dst_a1 dust surface emission
- cell_methods :
- time: mean
array([[[0., 0., ..., 0., 0.], [0., 0., ..., 0., 0.], ..., [0., 0., ..., 0., 0.], [0., 0., ..., 0., 0.]]], dtype=float32) - dst_a1_SRF(time, lat, lon)float32...
- units :
- kg/kg
- long_name :
- dst_a1 in bottom layer
- cell_methods :
- time: mean
array([[[1.690401e-25, 1.690404e-25, ..., 1.690420e-25, 1.690416e-25], [1.566239e-25, 1.585636e-25, ..., 1.527753e-25, 1.549883e-25], ..., [4.120412e-25, 4.134634e-25, ..., 4.135443e-25, 4.149061e-25], [4.763213e-25, 4.763230e-25, ..., 4.763214e-25, 4.763221e-25]]], dtype=float32) - dst_a3SF(time, lat, lon)float32...
- units :
- kg/m2/s
- long_name :
- dst_a3 dust surface emission
- cell_methods :
- time: mean
array([[[0., 0., ..., 0., 0.], [0., 0., ..., 0., 0.], ..., [0., 0., ..., 0., 0.], [0., 0., ..., 0., 0.]]], dtype=float32) - dst_a3_SRF(time, lat, lon)float32...
- units :
- kg/kg
- long_name :
- dst_a3 in bottom layer
- cell_methods :
- time: mean
array([[[1.200671e-36, 1.200675e-36, ..., 1.200683e-36, 1.200678e-36], [1.198952e-36, 1.203628e-36, ..., 1.185807e-36, 1.192196e-36], ..., [1.259527e-36, 1.260362e-36, ..., 1.266616e-36, 1.264360e-36], [1.265187e-36, 1.265188e-36, ..., 1.265170e-36, 1.265189e-36]]], dtype=float32) - ncl_a1_SRF(time, lat, lon)float32...
- units :
- kg/kg
- long_name :
- ncl_a1 in bottom layer
- cell_methods :
- time: mean
array([[[6.690547e-11, 6.690757e-11, ..., 6.690627e-11, 6.690584e-11], [5.812166e-11, 5.862775e-11, ..., 5.737775e-11, 5.779155e-11], ..., [7.523450e-11, 7.616446e-11, ..., 7.344442e-11, 7.427323e-11], [1.040894e-10, 1.040897e-10, ..., 1.040977e-10, 1.040923e-10]]], dtype=float32) - ncl_a2_SRF(time, lat, lon)float32...
- units :
- kg/kg
- long_name :
- ncl_a2 in bottom layer
- cell_methods :
- time: mean
array([[[1.162042e-12, 1.162076e-12, ..., 1.162045e-12, 1.162047e-12], [9.556951e-13, 9.658857e-13, ..., 9.395787e-13, 9.483833e-13], ..., [1.286056e-12, 1.303824e-12, ..., 1.250670e-12, 1.269658e-12], [1.729916e-12, 1.729917e-12, ..., 1.730069e-12, 1.729959e-12]]], dtype=float32) - ncl_a3_SRF(time, lat, lon)float32...
- units :
- kg/kg
- long_name :
- ncl_a3 in bottom layer
- cell_methods :
- time: mean
array([[[2.534133e-09, 2.534239e-09, ..., 2.534176e-09, 2.534170e-09], [2.070237e-09, 2.099929e-09, ..., 2.045326e-09, 2.052095e-09], ..., [2.871279e-09, 2.915507e-09, ..., 2.769490e-09, 2.816041e-09], [3.851034e-09, 3.851080e-09, ..., 3.851575e-09, 3.851235e-09]]], dtype=float32) - num_a1_SRF(time, lat, lon)float32...
- units :
- 1/kg
- long_name :
- num_a1 in bottom layer
- cell_methods :
- time: mean
array([[[6828341.5, 6828567. , ..., 6828409. , 6828361. ], [5741103. , 5798414.5, ..., 5651677. , 5702370. ], ..., [7267270. , 7329085.5, ..., 7180565.5, 7240463.5], [9054733. , 9054740. , ..., 9055335. , 9054925. ]]], dtype=float32) - num_a2_SRF(time, lat, lon)float32...
- units :
- 1/kg
- long_name :
- num_a2 in bottom layer
- cell_methods :
- time: mean
array([[[2.220809e+08, 2.220841e+08, ..., 2.220807e+08, 2.220808e+08], [2.677633e+08, 2.703211e+08, ..., 2.629721e+08, 2.656523e+08], ..., [2.470666e+07, 2.487942e+07, ..., 2.455113e+07, 2.463857e+07], [2.972624e+07, 2.972628e+07, ..., 2.972603e+07, 2.972658e+07]]], dtype=float32) - num_a3_SRF(time, lat, lon)float32...
- units :
- 1/kg
- long_name :
- num_a3 in bottom layer
- cell_methods :
- time: mean
array([[[ 78605.31 , 78607.336, ..., 78606.35 , 78605.82 ], [ 66740.22 , 67499.6 , ..., 65999.375, 66398.47 ], ..., [ 86280.47 , 87376.836, ..., 83778.125, 85027.62 ], [122514.2 , 122514.69 , ..., 122526.52 , 122518.305]]], dtype=float32) - pom_a1_SRF(time, lat, lon)float32...
- units :
- kg/kg
- long_name :
- pom_a1 in bottom layer
- cell_methods :
- time: mean
array([[[9.573988e-15, 9.574190e-15, ..., 9.574116e-15, 9.574053e-15], [8.245924e-15, 8.342208e-15, ..., 8.052072e-15, 8.166466e-15], ..., [9.765257e-14, 9.485337e-14, ..., 1.075398e-13, 1.017995e-13], [9.272710e-14, 9.272732e-14, ..., 9.274127e-14, 9.272722e-14]]], dtype=float32) - so4_a1_SRF(time, lat, lon)float32...
- units :
- kg/kg
- long_name :
- so4_a1 in bottom layer
- cell_methods :
- time: mean
array([[[9.113274e-12, 9.113700e-12, ..., 9.113306e-12, 9.113243e-12], [8.372648e-12, 8.425239e-12, ..., 8.253991e-12, 8.336460e-12], ..., [6.184848e-12, 6.085961e-12, ..., 6.510469e-12, 6.419563e-12], [4.953056e-12, 4.953060e-12, ..., 4.952936e-12, 4.953066e-12]]], dtype=float32) - so4_a2_SRF(time, lat, lon)float32...
- units :
- kg/kg
- long_name :
- so4_a2 in bottom layer
- cell_methods :
- time: mean
array([[[4.791994e-12, 4.792173e-12, ..., 4.791998e-12, 4.792051e-12], [4.669444e-12, 4.712257e-12, ..., 4.605458e-12, 4.638281e-12], ..., [8.913093e-13, 8.936445e-13, ..., 9.098057e-13, 9.086688e-13], [1.033685e-12, 1.033687e-12, ..., 1.033907e-12, 1.033689e-12]]], dtype=float32) - so4_a3_SRF(time, lat, lon)float32...
- units :
- kg/kg
- long_name :
- so4_a3 in bottom layer
- cell_methods :
- time: mean
array([[[1.570074e-13, 1.570149e-13, ..., 1.570102e-13, 1.570127e-13], [1.787423e-13, 1.804452e-13, ..., 1.778170e-13, 1.784164e-13], ..., [3.787335e-15, 3.735273e-15, ..., 3.935139e-15, 3.911957e-15], [4.112187e-15, 4.112259e-15, ..., 4.113934e-15, 4.112210e-15]]], dtype=float32) - soa_a1_SRF(time, lat, lon)float32...
- units :
- kg/kg
- long_name :
- soa_a1 in bottom layer
- cell_methods :
- time: mean
array([[[3.739058e-16, 3.739090e-16, ..., 3.739420e-16, 3.739394e-16], [4.305415e-16, 4.534934e-16, ..., 3.992738e-16, 4.133649e-16], ..., [1.736259e-13, 1.736912e-13, ..., 1.729528e-13, 1.728277e-13], [1.524771e-13, 1.524774e-13, ..., 1.525049e-13, 1.524774e-13]]], dtype=float32) - soa_a2_SRF(time, lat, lon)float32...
- units :
- kg/kg
- long_name :
- soa_a2 in bottom layer
- cell_methods :
- time: mean
array([[[2.563494e-17, 2.563813e-17, ..., 2.563659e-17, 2.563671e-17],
        [2.613736e-17, 2.762414e-17, ..., 2.623551e-17, 2.607846e-17],
        ...,
        [8.864554e-15, 9.009136e-15, ..., 8.720731e-15, 8.818566e-15],
        [8.941508e-15, 8.941533e-15, ..., 8.935399e-15, 8.941680e-15]]],
      dtype=float32)
- Conventions :
- CF-1.0
- source :
- CAM
- case :
- cam_00
- title :
- UNSET
- logname :
- pappup2
- host :
- keeling-j01
- Version :
- $Name$
- revision_Id :
- $Id$
- initial_file :
- /data/keeling/a/pappup2/a/CESM/CESM_input_data/atm/cam/inic/fv/cami-mam3_0000-01-01_1.9x2.5_L30_c090306.nc
- topography_file :
- /data/keeling/a/pappup2/a/CESM/CESM_input_data/atm/cam/topo/USGS-gtopo30_1.9x2.5_remap_c050602.nc
Plotting sea surface temperature (Noted as TS)
[5]:
data_00.TS
[5]:
<xarray.DataArray 'TS' (time: 1, lat: 96, lon: 144)>
array([[[273.15, 273.15, ..., 273.15, 273.15],
        [273.15, 273.15, ..., 273.15, 273.15],
        ...,
        [273.15, 273.15, ..., 273.15, 273.15],
        [273.15, 273.15, ..., 273.15, 273.15]]], dtype=float32)
Coordinates:
  * time     (time) object 0021-01-01 00:00:00
  * lat      (lat) float64 -90.0 -88.11 -86.21 -84.32 ... 84.32 86.21 88.11 90.0
  * lon      (lon) float64 0.0 2.5 5.0 7.5 10.0 ... 350.0 352.5 355.0 357.5
Attributes:
    units:         K
    long_name:     Surface temperature (radiative)
    cell_methods:  time: mean
xarray.DataArray
'TS'
- time: 1
- lat: 96
- lon: 144
- 273.1 273.1 273.1 273.1 273.1 273.1 ... 273.1 273.1 273.1 273.1 273.1
array([[[273.15, 273.15, ..., 273.15, 273.15], [273.15, 273.15, ..., 273.15, 273.15], ..., [273.15, 273.15, ..., 273.15, 273.15], [273.15, 273.15, ..., 273.15, 273.15]]], dtype=float32) - time(time)object0021-01-01 00:00:00
- long_name :
- time
- bounds :
- time_bnds
array([cftime.DatetimeNoLeap(21, 1, 1, 0, 0, 0, 0, has_year_zero=True)], dtype=object) - lat(lat)float64-90.0 -88.11 -86.21 ... 88.11 90.0
- long_name :
- latitude
- units :
- degrees_north
array([-90. , -88.105263, -86.210526, -84.315789, -82.421053, -80.526316, -78.631579, -76.736842, -74.842105, -72.947368, -71.052632, -69.157895, -67.263158, -65.368421, -63.473684, -61.578947, -59.684211, -57.789474, -55.894737, -54. , -52.105263, -50.210526, -48.315789, -46.421053, -44.526316, -42.631579, -40.736842, -38.842105, -36.947368, -35.052632, -33.157895, -31.263158, -29.368421, -27.473684, -25.578947, -23.684211, -21.789474, -19.894737, -18. , -16.105263, -14.210526, -12.315789, -10.421053, -8.526316, -6.631579, -4.736842, -2.842105, -0.947368, 0.947368, 2.842105, 4.736842, 6.631579, 8.526316, 10.421053, 12.315789, 14.210526, 16.105263, 18. , 19.894737, 21.789474, 23.684211, 25.578947, 27.473684, 29.368421, 31.263158, 33.157895, 35.052632, 36.947368, 38.842105, 40.736842, 42.631579, 44.526316, 46.421053, 48.315789, 50.210526, 52.105263, 54. , 55.894737, 57.789474, 59.684211, 61.578947, 63.473684, 65.368421, 67.263158, 69.157895, 71.052632, 72.947368, 74.842105, 76.736842, 78.631579, 80.526316, 82.421053, 84.315789, 86.210526, 88.105263, 90. ]) - lon(lon)float640.0 2.5 5.0 ... 352.5 355.0 357.5
- long_name :
- longitude
- units :
- degrees_east
array([  0. ,   2.5,   5. ,   7.5,  10. ,  12.5,  15. ,  17.5,  20. ,  22.5,
        25. ,  27.5,  30. ,  32.5,  35. ,  37.5,  40. ,  42.5,  45. ,  47.5,
        50. ,  52.5,  55. ,  57.5,  60. ,  62.5,  65. ,  67.5,  70. ,  72.5,
        75. ,  77.5,  80. ,  82.5,  85. ,  87.5,  90. ,  92.5,  95. ,  97.5,
       100. , 102.5, 105. , 107.5, 110. , 112.5, 115. , 117.5, 120. , 122.5,
       125. , 127.5, 130. , 132.5, 135. , 137.5, 140. , 142.5, 145. , 147.5,
       150. , 152.5, 155. , 157.5, 160. , 162.5, 165. , 167.5, 170. , 172.5,
       175. , 177.5, 180. , 182.5, 185. , 187.5, 190. , 192.5, 195. , 197.5,
       200. , 202.5, 205. , 207.5, 210. , 212.5, 215. , 217.5, 220. , 222.5,
       225. , 227.5, 230. , 232.5, 235. , 237.5, 240. , 242.5, 245. , 247.5,
       250. , 252.5, 255. , 257.5, 260. , 262.5, 265. , 267.5, 270. , 272.5,
       275. , 277.5, 280. , 282.5, 285. , 287.5, 290. , 292.5, 295. , 297.5,
       300. , 302.5, 305. , 307.5, 310. , 312.5, 315. , 317.5, 320. , 322.5,
       325. , 327.5, 330. , 332.5, 335. , 337.5, 340. , 342.5, 345. , 347.5,
       350. , 352.5, 355. , 357.5])
- units :
- K
- long_name :
- Surface temperature (radiative)
- cell_methods :
- time: mean
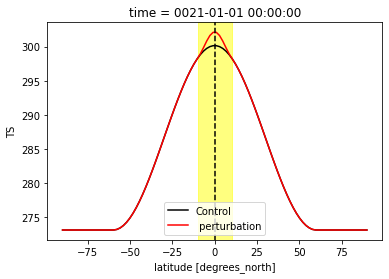
Here’s what the perturbation (data_00) looks like compared to the control aquaplanet.
[6]:
#surface_t2 = surface_t_2.mean('lon')
surface_t2 = data_control.TS.mean('lon')
surface_t2.plot(color="black",label="Control")
surface_t1 = data_00.TS.mean('lon')
surface_t1.plot(color="red",label=" perturbation")
#plot
plt.legend(loc='lower center')
plt.axvline(x=0,color="black",linestyle='dashed')
plt.axvspan(-10, 10, color='yellow', alpha=0.5)
[6]:
<matplotlib.patches.Polygon at 0x2ab5735e8820>
Other variables
Full list of CESM variables: https://www2.cesm.ucar.edu/models/cesm2/atmosphere/docs/ug6/hist_flds_f2000.html
[6]:
# The net longwave flux at the top of the model

data_00.FLNT
[6]:
<xarray.DataArray 'FLNT' (time: 1, lat: 96, lon: 144)>
array([[[195.13887, 195.13979, ..., 195.1388 , 195.13907],
        [193.65504, 193.08711, ..., 194.31952, 193.94109],
        ...,
        [196.7363 , 196.14072, ..., 196.9263 , 197.13918],
        [195.31691, 195.3155 , ..., 195.33676, 195.3262 ]]], dtype=float32)
Coordinates:
  * time     (time) object 0021-01-01 00:00:00
  * lat      (lat) float64 -90.0 -88.11 -86.21 -84.32 ... 84.32 86.21 88.11 90.0
  * lon      (lon) float64 0.0 2.5 5.0 7.5 10.0 ... 350.0 352.5 355.0 357.5
Attributes:
    Sampling_Sequence:  rad_lwsw
    units:              W/m2
    long_name:          Net longwave flux at top of model
    cell_methods:       time: mean
xarray.DataArray
'FLNT'
- time: 1
- lat: 96
- lon: 144
- 195.1 195.1 195.1 195.1 195.1 195.1 ... 195.3 195.3 195.3 195.3 195.3
array([[[195.13887, 195.13979, ..., 195.1388 , 195.13907], [193.65504, 193.08711, ..., 194.31952, 193.94109], ..., [196.7363 , 196.14072, ..., 196.9263 , 197.13918], [195.31691, 195.3155 , ..., 195.33676, 195.3262 ]]], dtype=float32) - time(time)object0021-01-01 00:00:00
- long_name :
- time
- bounds :
- time_bnds
array([cftime.DatetimeNoLeap(21, 1, 1, 0, 0, 0, 0, has_year_zero=True)], dtype=object) - lat(lat)float64-90.0 -88.11 -86.21 ... 88.11 90.0
- long_name :
- latitude
- units :
- degrees_north
array([-90. , -88.105263, -86.210526, -84.315789, -82.421053, -80.526316, -78.631579, -76.736842, -74.842105, -72.947368, -71.052632, -69.157895, -67.263158, -65.368421, -63.473684, -61.578947, -59.684211, -57.789474, -55.894737, -54. , -52.105263, -50.210526, -48.315789, -46.421053, -44.526316, -42.631579, -40.736842, -38.842105, -36.947368, -35.052632, -33.157895, -31.263158, -29.368421, -27.473684, -25.578947, -23.684211, -21.789474, -19.894737, -18. , -16.105263, -14.210526, -12.315789, -10.421053, -8.526316, -6.631579, -4.736842, -2.842105, -0.947368, 0.947368, 2.842105, 4.736842, 6.631579, 8.526316, 10.421053, 12.315789, 14.210526, 16.105263, 18. , 19.894737, 21.789474, 23.684211, 25.578947, 27.473684, 29.368421, 31.263158, 33.157895, 35.052632, 36.947368, 38.842105, 40.736842, 42.631579, 44.526316, 46.421053, 48.315789, 50.210526, 52.105263, 54. , 55.894737, 57.789474, 59.684211, 61.578947, 63.473684, 65.368421, 67.263158, 69.157895, 71.052632, 72.947368, 74.842105, 76.736842, 78.631579, 80.526316, 82.421053, 84.315789, 86.210526, 88.105263, 90. ]) - lon(lon)float640.0 2.5 5.0 ... 352.5 355.0 357.5
- long_name :
- longitude
- units :
- degrees_east
array([  0. ,   2.5,   5. ,   7.5,  10. ,  12.5,  15. ,  17.5,  20. ,  22.5,
        25. ,  27.5,  30. ,  32.5,  35. ,  37.5,  40. ,  42.5,  45. ,  47.5,
        50. ,  52.5,  55. ,  57.5,  60. ,  62.5,  65. ,  67.5,  70. ,  72.5,
        75. ,  77.5,  80. ,  82.5,  85. ,  87.5,  90. ,  92.5,  95. ,  97.5,
       100. , 102.5, 105. , 107.5, 110. , 112.5, 115. , 117.5, 120. , 122.5,
       125. , 127.5, 130. , 132.5, 135. , 137.5, 140. , 142.5, 145. , 147.5,
       150. , 152.5, 155. , 157.5, 160. , 162.5, 165. , 167.5, 170. , 172.5,
       175. , 177.5, 180. , 182.5, 185. , 187.5, 190. , 192.5, 195. , 197.5,
       200. , 202.5, 205. , 207.5, 210. , 212.5, 215. , 217.5, 220. , 222.5,
       225. , 227.5, 230. , 232.5, 235. , 237.5, 240. , 242.5, 245. , 247.5,
       250. , 252.5, 255. , 257.5, 260. , 262.5, 265. , 267.5, 270. , 272.5,
       275. , 277.5, 280. , 282.5, 285. , 287.5, 290. , 292.5, 295. , 297.5,
       300. , 302.5, 305. , 307.5, 310. , 312.5, 315. , 317.5, 320. , 322.5,
       325. , 327.5, 330. , 332.5, 335. , 337.5, 340. , 342.5, 345. , 347.5,
       350. , 352.5, 355. , 357.5])
- Sampling_Sequence :
- rad_lwsw
- units :
- W/m2
- long_name :
- Net longwave flux at top of model
- cell_methods :
- time: mean
[7]:
# Net longwave flux at the surface

data_00.FLNS
[7]:
<xarray.DataArray 'FLNS' (time: 1, lat: 96, lon: 144)>
array([[[79.3983  , 79.40211 , ..., 79.39641 , 79.39886 ],
        [80.2299  , 79.92358 , ..., 80.08627 , 80.222595],
        ...,
        [79.46216 , 78.62718 , ..., 80.00724 , 79.98925 ],
        [77.15022 , 77.14897 , ..., 77.19055 , 77.16949 ]]], dtype=float32)
Coordinates:
  * time     (time) object 0021-01-01 00:00:00
  * lat      (lat) float64 -90.0 -88.11 -86.21 -84.32 ... 84.32 86.21 88.11 90.0
  * lon      (lon) float64 0.0 2.5 5.0 7.5 10.0 ... 350.0 352.5 355.0 357.5
Attributes:
    Sampling_Sequence:  rad_lwsw
    units:              W/m2
    long_name:          Net longwave flux at surface
    cell_methods:       time: mean
xarray.DataArray
'FLNS'
- time: 1
- lat: 96
- lon: 144
- 79.4 79.4 79.4 79.4 79.4 79.4 ... 77.15 77.18 77.18 77.19 77.19 77.17
array([[[79.3983 , 79.40211 , ..., 79.39641 , 79.39886 ], [80.2299 , 79.92358 , ..., 80.08627 , 80.222595], ..., [79.46216 , 78.62718 , ..., 80.00724 , 79.98925 ], [77.15022 , 77.14897 , ..., 77.19055 , 77.16949 ]]], dtype=float32) - time(time)object0021-01-01 00:00:00
- long_name :
- time
- bounds :
- time_bnds
array([cftime.DatetimeNoLeap(21, 1, 1, 0, 0, 0, 0, has_year_zero=True)], dtype=object) - lat(lat)float64-90.0 -88.11 -86.21 ... 88.11 90.0
- long_name :
- latitude
- units :
- degrees_north
array([-90. , -88.105263, -86.210526, -84.315789, -82.421053, -80.526316, -78.631579, -76.736842, -74.842105, -72.947368, -71.052632, -69.157895, -67.263158, -65.368421, -63.473684, -61.578947, -59.684211, -57.789474, -55.894737, -54. , -52.105263, -50.210526, -48.315789, -46.421053, -44.526316, -42.631579, -40.736842, -38.842105, -36.947368, -35.052632, -33.157895, -31.263158, -29.368421, -27.473684, -25.578947, -23.684211, -21.789474, -19.894737, -18. , -16.105263, -14.210526, -12.315789, -10.421053, -8.526316, -6.631579, -4.736842, -2.842105, -0.947368, 0.947368, 2.842105, 4.736842, 6.631579, 8.526316, 10.421053, 12.315789, 14.210526, 16.105263, 18. , 19.894737, 21.789474, 23.684211, 25.578947, 27.473684, 29.368421, 31.263158, 33.157895, 35.052632, 36.947368, 38.842105, 40.736842, 42.631579, 44.526316, 46.421053, 48.315789, 50.210526, 52.105263, 54. , 55.894737, 57.789474, 59.684211, 61.578947, 63.473684, 65.368421, 67.263158, 69.157895, 71.052632, 72.947368, 74.842105, 76.736842, 78.631579, 80.526316, 82.421053, 84.315789, 86.210526, 88.105263, 90. ]) - lon(lon)float640.0 2.5 5.0 ... 352.5 355.0 357.5
- long_name :
- longitude
- units :
- degrees_east
array([  0. ,   2.5,   5. ,   7.5,  10. ,  12.5,  15. ,  17.5,  20. ,  22.5,
        25. ,  27.5,  30. ,  32.5,  35. ,  37.5,  40. ,  42.5,  45. ,  47.5,
        50. ,  52.5,  55. ,  57.5,  60. ,  62.5,  65. ,  67.5,  70. ,  72.5,
        75. ,  77.5,  80. ,  82.5,  85. ,  87.5,  90. ,  92.5,  95. ,  97.5,
       100. , 102.5, 105. , 107.5, 110. , 112.5, 115. , 117.5, 120. , 122.5,
       125. , 127.5, 130. , 132.5, 135. , 137.5, 140. , 142.5, 145. , 147.5,
       150. , 152.5, 155. , 157.5, 160. , 162.5, 165. , 167.5, 170. , 172.5,
       175. , 177.5, 180. , 182.5, 185. , 187.5, 190. , 192.5, 195. , 197.5,
       200. , 202.5, 205. , 207.5, 210. , 212.5, 215. , 217.5, 220. , 222.5,
       225. , 227.5, 230. , 232.5, 235. , 237.5, 240. , 242.5, 245. , 247.5,
       250. , 252.5, 255. , 257.5, 260. , 262.5, 265. , 267.5, 270. , 272.5,
       275. , 277.5, 280. , 282.5, 285. , 287.5, 290. , 292.5, 295. , 297.5,
       300. , 302.5, 305. , 307.5, 310. , 312.5, 315. , 317.5, 320. , 322.5,
       325. , 327.5, 330. , 332.5, 335. , 337.5, 340. , 342.5, 345. , 347.5,
       350. , 352.5, 355. , 357.5])
- Sampling_Sequence :
- rad_lwsw
- units :
- W/m2
- long_name :
- Net longwave flux at surface
- cell_methods :
- time: mean
[8]:
# Net solar flux at the top of the model

data_00.FSNT
[8]:
<xarray.DataArray 'FSNT' (time: 1, lat: 96, lon: 144)>
array([[[0.630925, 0.630922, ..., 0.630927, 0.630926],
        [8.233937, 8.205184, ..., 8.307201, 8.300164],
        ...,
        [8.369527, 8.322571, ..., 8.261292, 8.320506],
        [0.63259 , 0.632591, ..., 0.632564, 0.632591]]], dtype=float32)
Coordinates:
  * time     (time) object 0021-01-01 00:00:00
  * lat      (lat) float64 -90.0 -88.11 -86.21 -84.32 ... 84.32 86.21 88.11 90.0
  * lon      (lon) float64 0.0 2.5 5.0 7.5 10.0 ... 350.0 352.5 355.0 357.5
Attributes:
    Sampling_Sequence:  rad_lwsw
    units:              W/m2
    long_name:          Net solar flux at top of model
    cell_methods:       time: mean
xarray.DataArray
'FSNT'
- time: 1
- lat: 96
- lon: 144
- 0.6309 0.6309 0.6309 0.6309 0.6309 ... 0.6326 0.6326 0.6326 0.6326
array([[[0.630925, 0.630922, ..., 0.630927, 0.630926], [8.233937, 8.205184, ..., 8.307201, 8.300164], ..., [8.369527, 8.322571, ..., 8.261292, 8.320506], [0.63259 , 0.632591, ..., 0.632564, 0.632591]]], dtype=float32) - time(time)object0021-01-01 00:00:00
- long_name :
- time
- bounds :
- time_bnds
array([cftime.DatetimeNoLeap(21, 1, 1, 0, 0, 0, 0, has_year_zero=True)], dtype=object) - lat(lat)float64-90.0 -88.11 -86.21 ... 88.11 90.0
- long_name :
- latitude
- units :
- degrees_north
array([-90. , -88.105263, -86.210526, -84.315789, -82.421053, -80.526316, -78.631579, -76.736842, -74.842105, -72.947368, -71.052632, -69.157895, -67.263158, -65.368421, -63.473684, -61.578947, -59.684211, -57.789474, -55.894737, -54. , -52.105263, -50.210526, -48.315789, -46.421053, -44.526316, -42.631579, -40.736842, -38.842105, -36.947368, -35.052632, -33.157895, -31.263158, -29.368421, -27.473684, -25.578947, -23.684211, -21.789474, -19.894737, -18. , -16.105263, -14.210526, -12.315789, -10.421053, -8.526316, -6.631579, -4.736842, -2.842105, -0.947368, 0.947368, 2.842105, 4.736842, 6.631579, 8.526316, 10.421053, 12.315789, 14.210526, 16.105263, 18. , 19.894737, 21.789474, 23.684211, 25.578947, 27.473684, 29.368421, 31.263158, 33.157895, 35.052632, 36.947368, 38.842105, 40.736842, 42.631579, 44.526316, 46.421053, 48.315789, 50.210526, 52.105263, 54. , 55.894737, 57.789474, 59.684211, 61.578947, 63.473684, 65.368421, 67.263158, 69.157895, 71.052632, 72.947368, 74.842105, 76.736842, 78.631579, 80.526316, 82.421053, 84.315789, 86.210526, 88.105263, 90. ]) - lon(lon)float640.0 2.5 5.0 ... 352.5 355.0 357.5
- long_name :
- longitude
- units :
- degrees_east
array([  0. ,   2.5,   5. ,   7.5,  10. ,  12.5,  15. ,  17.5,  20. ,  22.5,
        25. ,  27.5,  30. ,  32.5,  35. ,  37.5,  40. ,  42.5,  45. ,  47.5,
        50. ,  52.5,  55. ,  57.5,  60. ,  62.5,  65. ,  67.5,  70. ,  72.5,
        75. ,  77.5,  80. ,  82.5,  85. ,  87.5,  90. ,  92.5,  95. ,  97.5,
       100. , 102.5, 105. , 107.5, 110. , 112.5, 115. , 117.5, 120. , 122.5,
       125. , 127.5, 130. , 132.5, 135. , 137.5, 140. , 142.5, 145. , 147.5,
       150. , 152.5, 155. , 157.5, 160. , 162.5, 165. , 167.5, 170. , 172.5,
       175. , 177.5, 180. , 182.5, 185. , 187.5, 190. , 192.5, 195. , 197.5,
       200. , 202.5, 205. , 207.5, 210. , 212.5, 215. , 217.5, 220. , 222.5,
       225. , 227.5, 230. , 232.5, 235. , 237.5, 240. , 242.5, 245. , 247.5,
       250. , 252.5, 255. , 257.5, 260. , 262.5, 265. , 267.5, 270. , 272.5,
       275. , 277.5, 280. , 282.5, 285. , 287.5, 290. , 292.5, 295. , 297.5,
       300. , 302.5, 305. , 307.5, 310. , 312.5, 315. , 317.5, 320. , 322.5,
       325. , 327.5, 330. , 332.5, 335. , 337.5, 340. , 342.5, 345. , 347.5,
       350. , 352.5, 355. , 357.5])
- Sampling_Sequence :
- rad_lwsw
- units :
- W/m2
- long_name :
- Net solar flux at top of model
- cell_methods :
- time: mean